I don’t sleep very well.
I tend to go to bed late and wake early. I drink coffee. I drink a lot of coffee.
For quite some time (years actually), I’ve thought, “Maybe, just maybe…. I should sleep a bit more than I do,” but this was just a general feeling, a cloudy notion that there might be room to improve this aspect of my life. Maybe I should sleep in a bit longer on the weekend? Maybe I should stop drinking coffee after 1am? Maybe I’M fine and it is YOU that have the problem. Maybe I’ve been in denial.
This changed this week.
A few days ago I downloaded Sleep Cycle for my iPhone. I had heard that it was an easier, less abrupt alarm clock, that promised to make my mornings a bit less painful. As it turns out, the alarm clock is fantastic, but something else immediately got my attention.
Using Sleep Cycle, when you go to bed, you set the alarm, sleep, and then it wakes you up.
Simple. In fact, no different than the alarm I was previously using on my iPhone for years.
However…. There is one small, important difference. It keeps track of what time you set the alarm and records it for each day.
Suddenly I know what time I went to bed for any day of the week. I also know what time I woke up. This means I ALSO precisely know how much sleep I’m getting.
I was in for a surprise.
This has been an average week and I’ve only been using this app for 3 days, but so far this is the report it gives me:
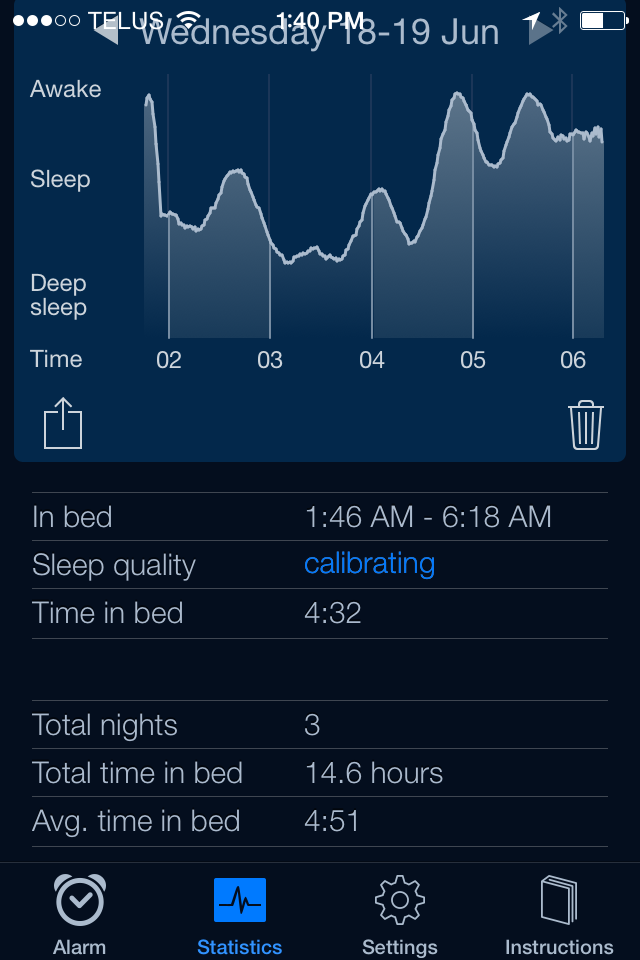
The interface of the “Sleep Cycle” App
If you are supposed to sleep 8 hours a night, that means I should have slept somewhere in the neighborhood of 24 hrs. Right now my total sleep for the past 72 hours is 14. Uh oh.
Instead of having a hunch that I might need to change my habits, I now know exactly how dramatically far short I’m falling from the norm and what I need to do to change. All it took was simply clicking a button, once, each day. Something I was doing anyways. The data recording, aggregation and reports are all handled for me. This, to me, is a very pure, very powerful example of how simple data can help you uncover and understand what really is happening and then allow you to make changes accordingly.
This is a very simple example of how data can help you approach a problem. Collecting this data has taken no additional time out of my day, but it has made a huge impact on my thinking.
This happens to be exactly at the heart of what we work to accomplish in schools everyday with eWalk. Using simple data to make big changes.
Here’s your challenge for this next week: Look around your school and think of something that you have a “hunch” about, something that you feel could be improved. Then fire up eWalk and build a simple template to record data about the issue. If you don’t have eWalk, just send me an email and we will get you setup today – it only takes a couple of minutes.
Don’t make the template any bigger than 2-3 questions. Use simple things like our timers to time things you see or use counters to count things going on in your school. Keep it simple. Load up the template on your phone or iPad and spend the next 5 days recording data about the issue. I can guarantee that you will be surprised by what you find. Send us your results and I would be happy to publish them right here as part of our blog. If you’ve found something to improve, chances are very good that other readers here will benefit by learning from you.
I look forward to hearing about your data adventures next week. I promise to be well rested when I read them.